Buckling Simulation for 3D Printing in Fresh Concrete
Background Information
3D concrete printing technology has opened up a new era for the construction industry as a new approach to manufacture concrete structures, with the advantage of eliminating the need of customising one-used formwork/mold on non-standard geometries. Witteveen+Bos has been developing and working on 3D concrete printing initiatives all around the world.
One major challenge to 3D print with fresh concrete in layer-based extrusion process is to overcome buckling and collapsing during printing as there is no formwork or mold to support fresh concrete stay in shape. Here, we will focus on how to avoid buckling in 3D printing through Finite Element Analysis using Karamba 3D.
There are two modes of potential failure in the 3D concrete printing process; Elastic and Plastic buckling. Elastic Buckling is about the structure bending and failing due to instability; Plastic Buckling is about exceeding the material’s strength limit. Out of our physical experiments, plastic buckling is less likely to occur in the case of 3D concrete printing process as slim and tall geometry. In short, elastic buckling usually dominates the printing failure.
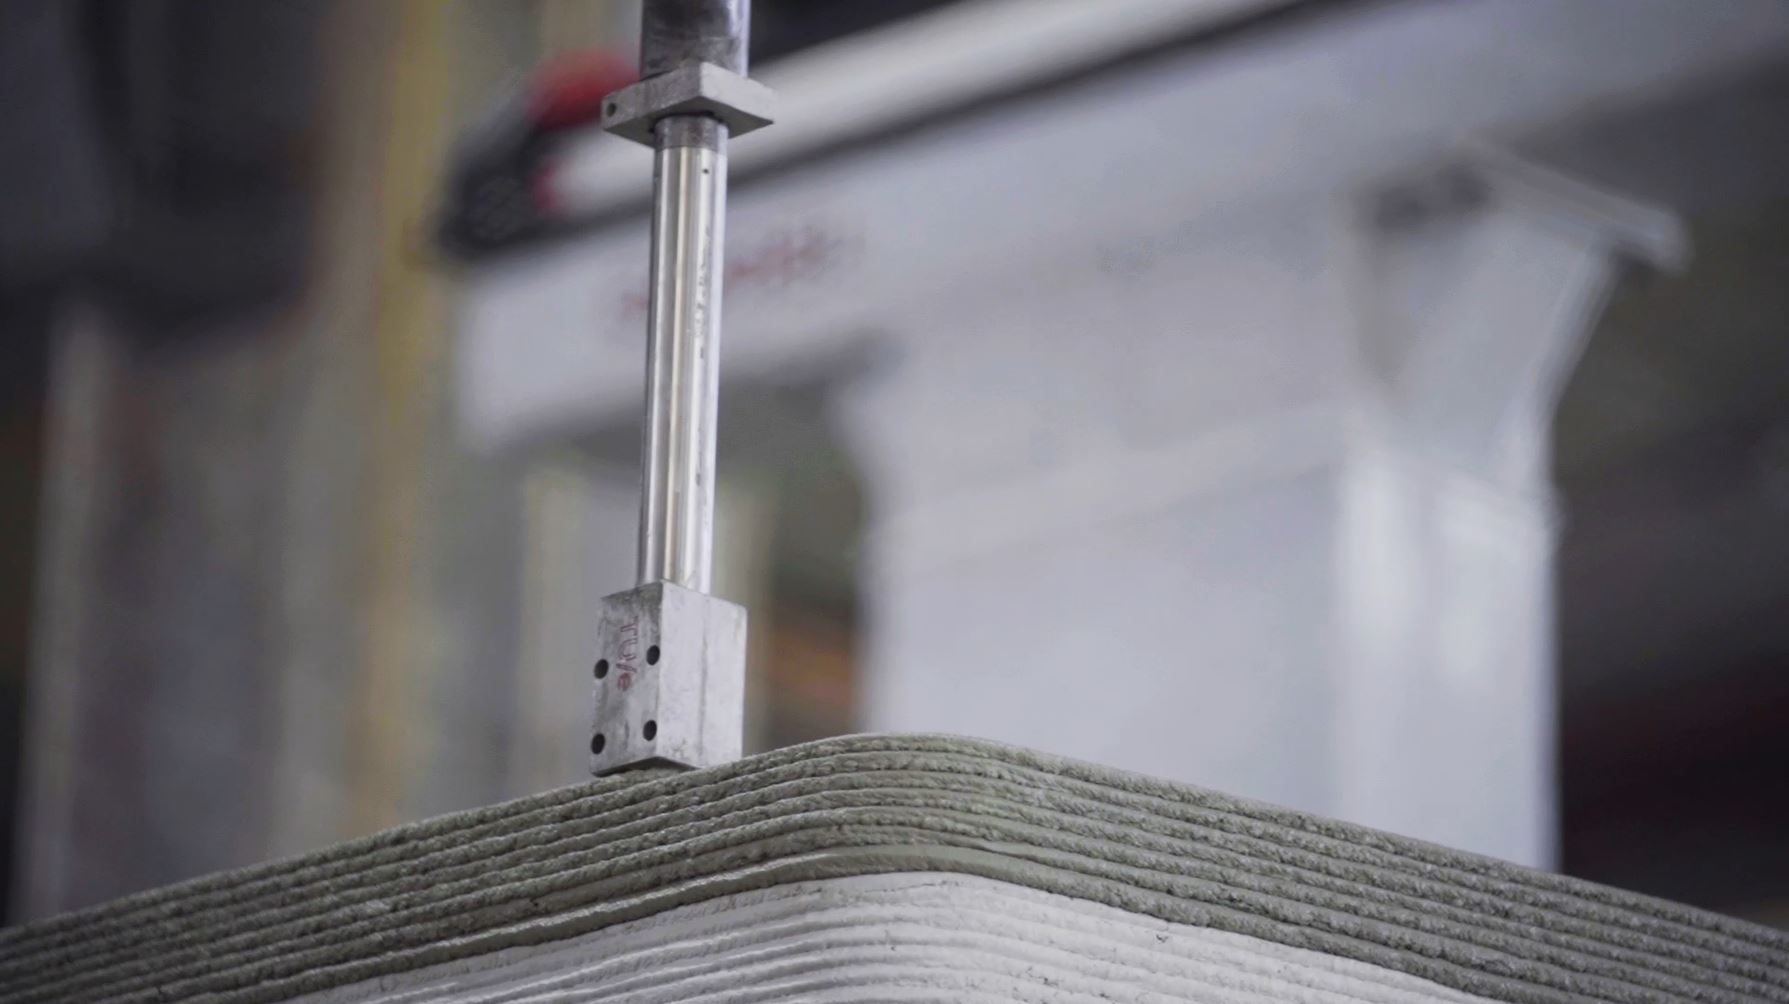
To give an idea of what kind of buckling we are dealing with, please have a look at the illustration below. The goal was to print a straight wall, but it tumbled down as the fresh concrete was NOT stiff enough to support the self-weight deposited on top of each layer.
There are 2 stages shown in the buckling process.
- Onset of buckling: subtle settlement occurred as buckling.
- Collapsing: structure failing.
What we are going to do is numerically simulating Onset of buckling to avoid the subsequent collapsing stage.
This became an interesting topic because traditionally fresh concrete can be checked in slump test, which allows you to measure the workability of freshly made concrete. In contrast to 3D concrete printing applications, there are no such official tests available to predict the print performance of a mixture. However, alternatively, if we consider the fresh concrete as soil, we can make use of existing geotechnical testing methods, which we are not going to discuss here.
The 3D concrete printing research program at Eindhoven University of Technologies (TU/e), has published their pioneering research results for studying the structural behaviour of 3D printed concrete elements. Two papers relevant to the earlier described buckling simulation tools are published by TU/e:
- Early age mechanical behaviour of 3D printed concrete: Numerical modeling and experimental testing.
- Mechanical performance of wall structure in 3D printing process: theory, design tools and experiments.
Simulation inputs
To perform and verify the buckling simulation with our software, we used the following data from the above papers from TU/e.
- Material: Weber Beamix 145-1
- Printing Speed: 5000 mm/min
- Print width: 5cm
- Geometry: cylinder in radius 25cm
- Layer height: 1cm
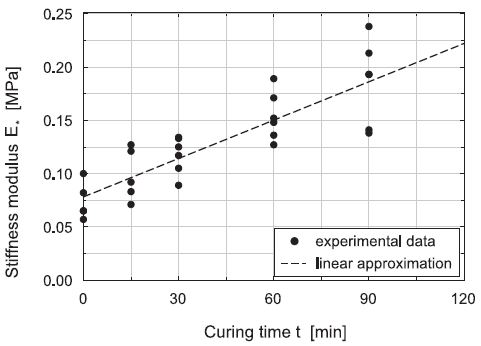
- The following two graphs indicating early initial strength of fresh concrete and strength development;
 |
 |
| source: TU/Eindhoven | source: TU/Eindhoven |
Initial strength of fresh concrete and strength development of fresh concrete are two important factors to determine the structural behaviour during the 3D printing process. They both have a direct impact on the setting of time-dependent material properties. This means that the strength and stiffness of fresh concrete are increasing during the printing process.
Based on the graphs above, we know the following early age properties of the fresh concrete:
- Stiffness Module[MPa] = 0.0781 + 0.0012t
- Compressive Strength[kPa] = 5.984 + 0.147t
Based on the printing path length and the printing speed of each layer, we can calculate the actual age of each layer as follows:
concreteAging= []
for min in mins:
    if len(concreteAging) == 0:
        concreteAging.append(min)
    else:
        for i in range(len(concreteAging)):
            concreteAging[i] += min
        concreteAging.append(min)
With the age of each layer, we can acquire the actual young’s module and compressive strength of each layer:
Now we know the properties of each layer, the next step is to parametrically develop a numerical model to automate the steps above. The benefit of parametric modelling is that one doesn’t have to rebuild repetitive tasks for future applications, if the principle remains the same.
Outcomes
 |
 |
 |
 |
 |
 |
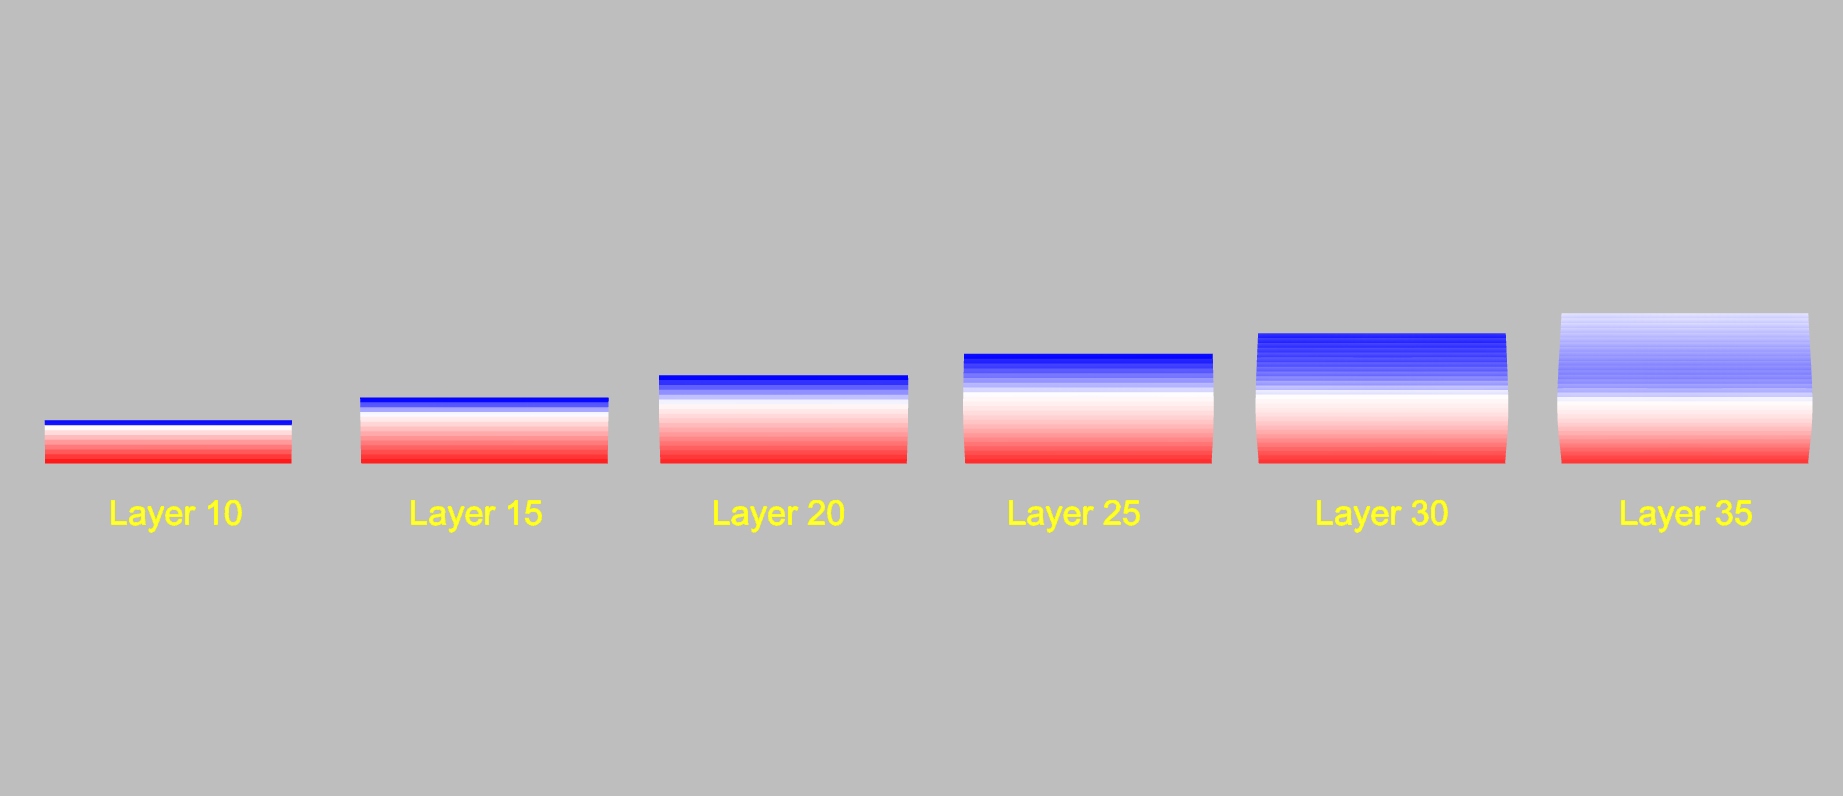
Finally, we reach buckling simulation outcomes.
When looking at the above simulation results, the maximum displacement is our failure indicator since we focus on elastic buckling. For our simulations we assumed a maximum displacement limit is 1cm displacement, but this limit will be updated and verified in a later stage with physical experiments.
There are a few things to point out for using Karamba in such simulations.
- A zero-thickness shell structure was selected as a cross-section element with a constant height applied. Karamba doesn’t support volumetric elements, as such, the layer centre line needs to be used to generate the shell structure instead of the 3D layer geometry.
- Spring cross-section was applied at the footing in order to define the stiffness relation over the buckling shapes.
- Karamba’s FEA calculations are based on the assumptions of small displacements in a ratio of about 10% compared to cross-section’s dimension (in this case: the cross-section of the print layer), as such, complete failure of the structure will not be visualised in the simulation
One may ask, how can we improve the maximum printable height before elastic buckling occurs? Well, there are some factors we can work on:
- Print slower: slower it prints, higher strength and stiffness are developed during printing.
- Widen print layer width: wider it prints, more stable it will be.
- Add internal structure.
- Avoid long straight walls.
- Tweak material properties, e.g. mixing cement accelerator.
Here is a quick example of how adding internal structure can help with minimising buckling compared to no internal structure.
Validation
To validate our buckling simulation tool, we compare our Karamba outcomes with the papers from TU/e above. The comparison is made in two parts.
- Digitally compare with another commercially available FEA software Abaqus.
- Physically compare with a 3D concrete printing experiment.
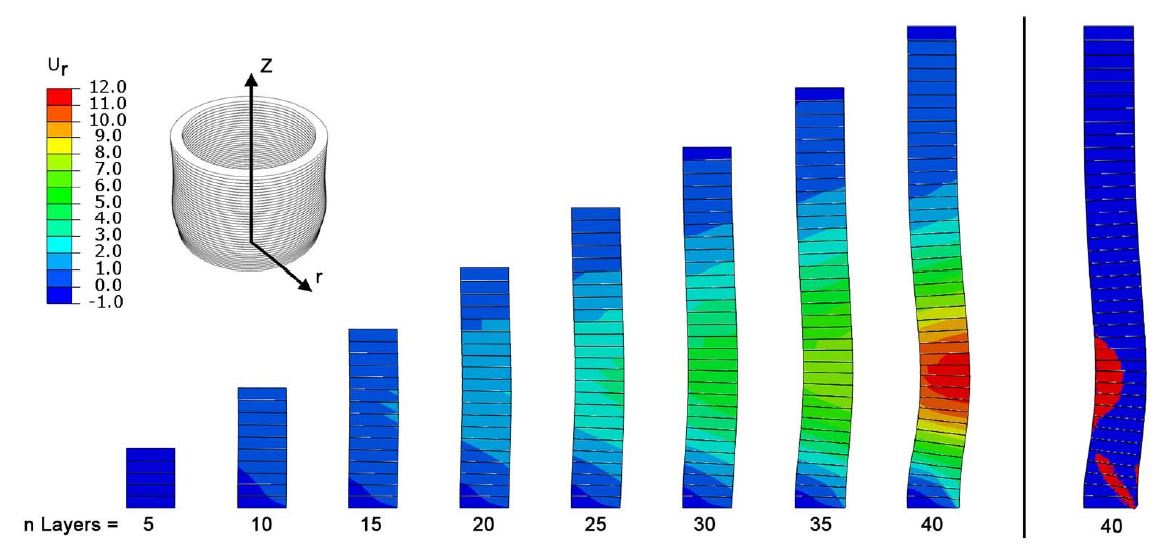 |
| Abaqus numeriacl result. Gradient color indicates radial displacement. source: TU/Eindhoven |
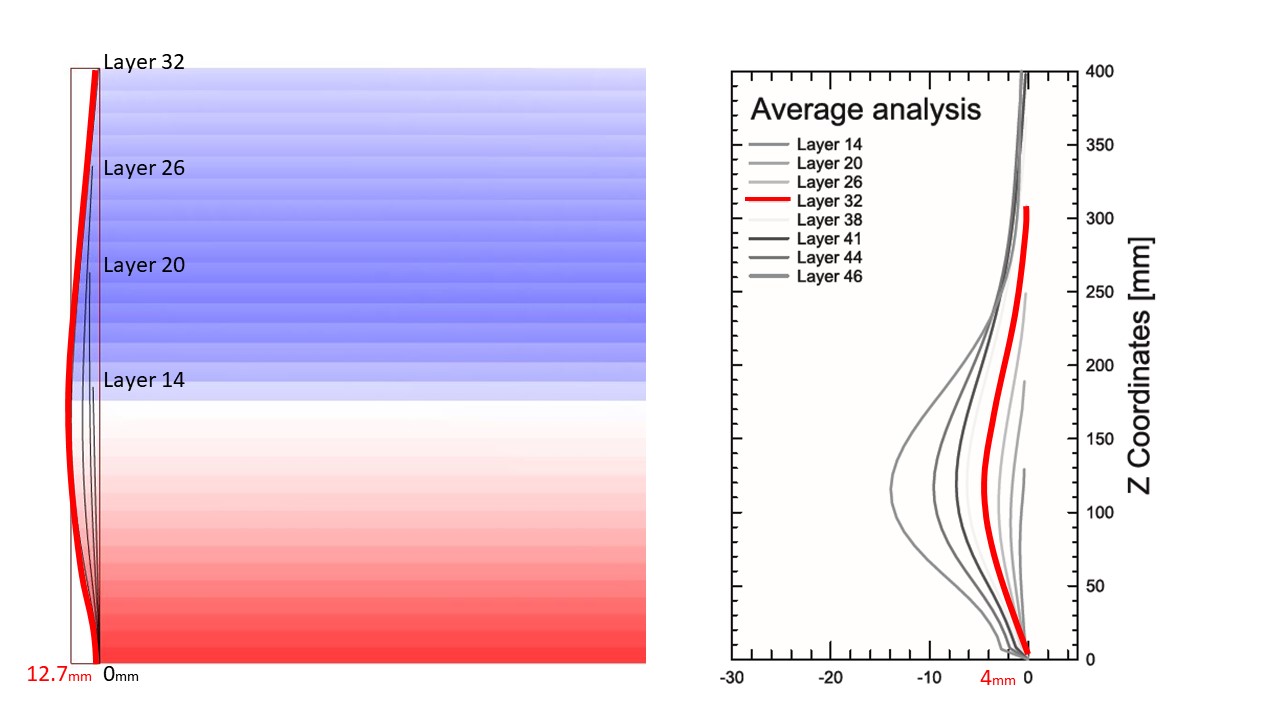 |
| Comparison between Karamba and Abaqus in buckling shape. Right image source: TU/Eindhoven |
The above image shows at the layer 32, Karamba model is having a maximum 12mm radial displacement, which is three times larger compared to the Abauqs value of 4mm. If we take one step back comparing at layer 20, it is Karamba 6.3mm versus Abaqus 2mm, the difference remains roughly three times larger to Abaqus.
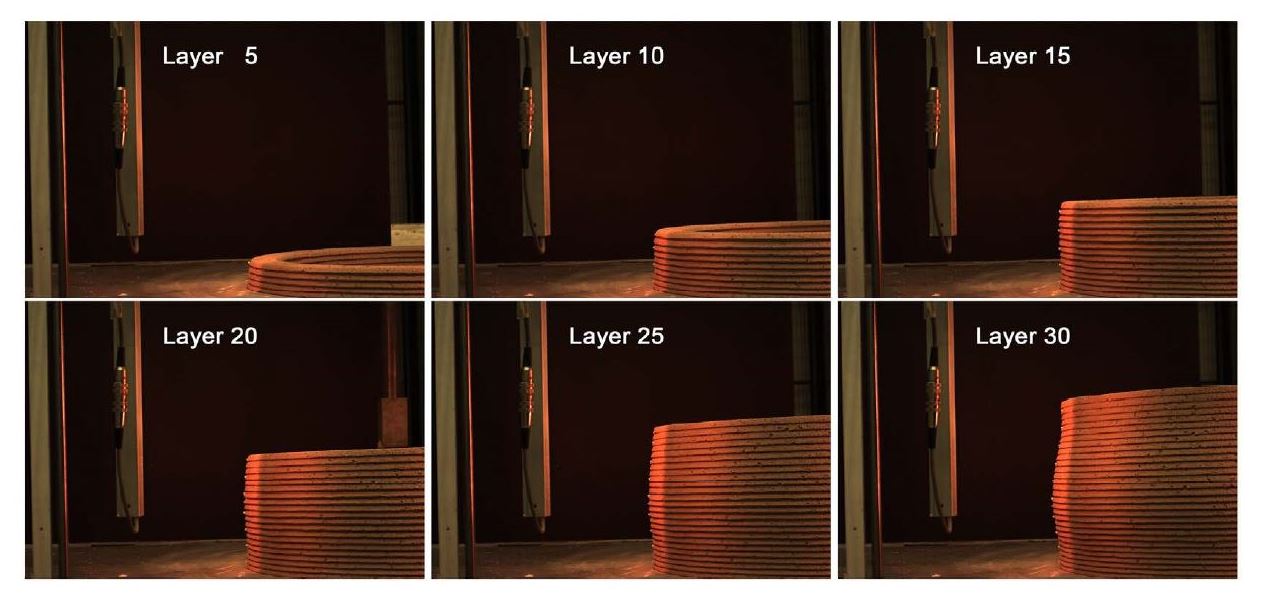 |
| Deformed shape of a cylinder during the printing process. source: TU/Eindhoven |
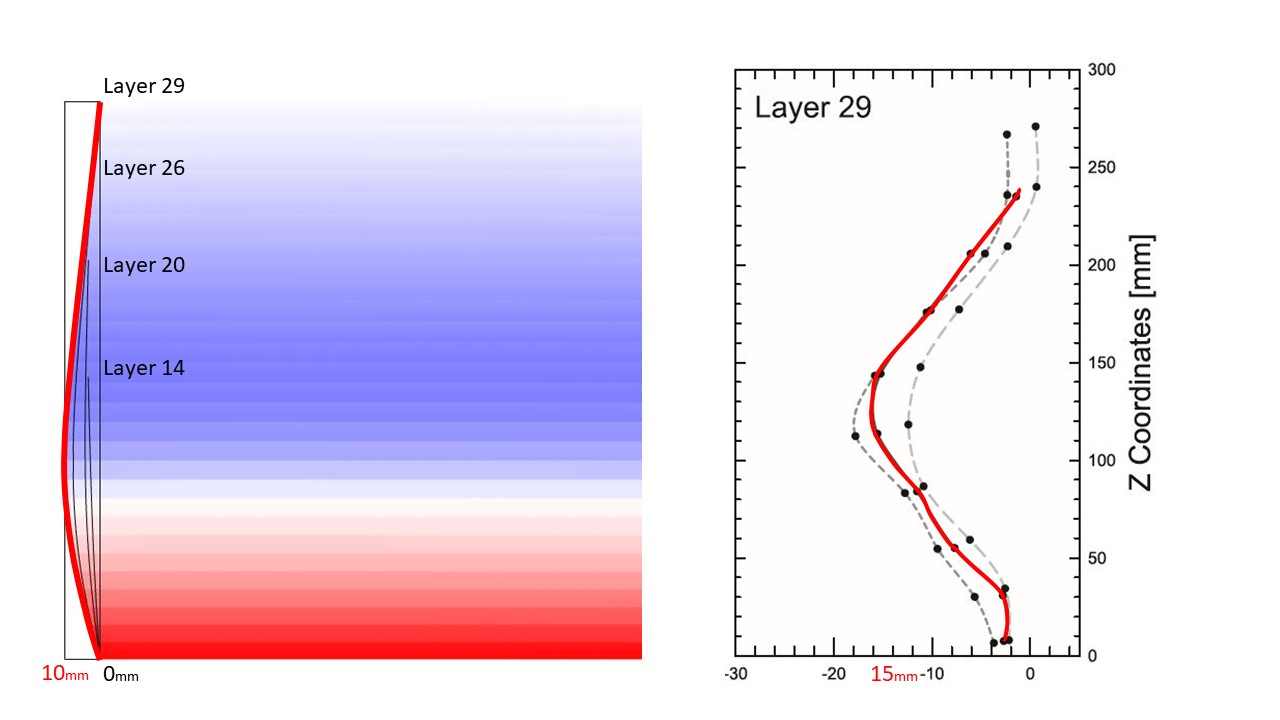 |
| Comparison between Karamba and physical printing process in buckling shape. Right image source: TU/Eindhoven |
Next thing is to compare the Karamba model with the physical printing process. At layer 29, Karamba is showing a maximum 10mm radial displacement, which is smaller than the physical printing process of on average 15mm.
These differences explain that both Karamba and Abaqus models overestimate the stability compare the physical printing process, but Karamba’s results are significantly closer to the physical printing process. It was mentioned in the TU/e paper that the reason likely due to the compaction of homogeneous testing samples made for geotechnical testing methods, which typically does not apply to the actual printing process. As a result, the input of customised material properties for compacted concrete might be stronger than the printed concrete in terms of strength and stiffness.
Conclusion
To conclude, this buckling simulation can be used as a quick analytical tool, allowing you to digitally predict what would happen prior to the physical experiments. This not only minimise the chance of unnecessary trial and error but also give a better understanding of improving 3D concrete printing process.
Upon the validation process, it seems the Karamba models slightly overestimate the stability, the difference is approximately in control of 10mm, which is considered acceptable for the preliminary analytical tool.
The benefit of using Karamba3D in Grasshopper environment in such simulation is that the computation time is significantly reduced as it takes a matter of seconds to calculate the results. The second benefit is that it provides designers to conduct comprehensive analysis within the design environment, eliminating the need of data transferring from one software to another, which often causes data loss during the transition process. Last but not least, the tool is built in the parametrical process, we can reuse the script by simply inputting given geometries without the need to rebuild the numerical model from scratch again and again.
Please contact me if you are interested in this tool: shaun.wu@witteveenbos.com
Software requirements: Rhino6, Karamba3D, Human
I was honored to be invited by Karamba3D team for sharing our 3D Concrete Printing Development over an online webinar, and an introduction of buckling simulation tool was included.
In Collaboration With: Witteveen+Bos, Karamba3D, Nanyang Technological University
Personnel: Jordy Vos, Shaun Wu, Clemens Preisinger, Matthew Tam, Nelson Xiong Neng
Personnel of Reference Source: Theo Salet, Rob Wolfs
License: CC-BY-SA 4.0